
When
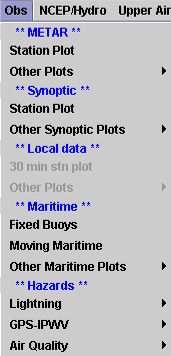
you open FX-Net and click on  on the menu bar, a menu opens up with surface observations that
can be plotted. As with all other menus, the availability
of the data depends on what map is selected for the primary window.
Data that is available will be black and greyed out items are not
available at the scale you have selected.
on the menu bar, a menu opens up with surface observations that
can be plotted. As with all other menus, the availability
of the data depends on what map is selected for the primary window.
Data that is available will be black and greyed out items are not
available at the scale you have selected.
Data
is grouped by type, most of it is surface data. Exceptions
include cloud ceiling height data under Other
Plots, and GPS-IPWV
data. There are blue headings that seperate the different
products. **METAR**
data is surface data that is reported from hundreds of sites across
the continent, generally hourly. Under **Hazards**
is Lightning data, as well as new datasest Air Quality
and GPS-IPWV.
As
mentioned, the new Air Quality products are located at
the bottom of the Obs menu. These include the air quality
paramters from stations in New Hampshire, called AIRMAP,
as well as the National 1-Hour Average O3 (Ozone) and
Particulate Matter (PM10 and PM2.5) from
the AIRNow network.
Loading
these is similar to any other type of data. First, select
your number of frames from the tool bar. If you only select
1, then you get the latest data set or analysis. If you
select more than 1, you get that number of sets or analyses starting
with the most recent and going back in time. Some examples
of the data follow.
|
 |
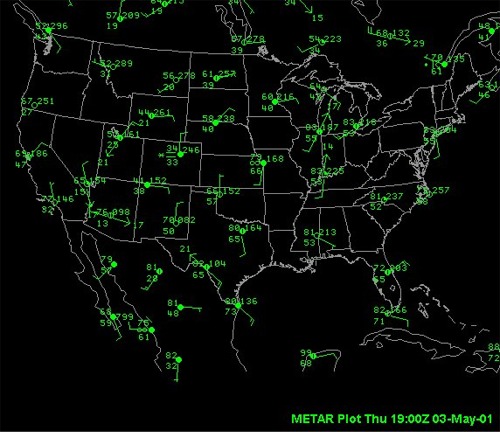 |
This
map is a METAR Station Plot
of wind, temperature, dew point, surface pressure, sky cover and
wind gust. The data looks sparsely plotted, but this is where
zooming in on an area will get
you a higher density of data. Center the mouse pointer on
where you want to focus and either hold down the Alt button and
left click; or if you have a 3 button mouse, click the center button.
The result is below. |
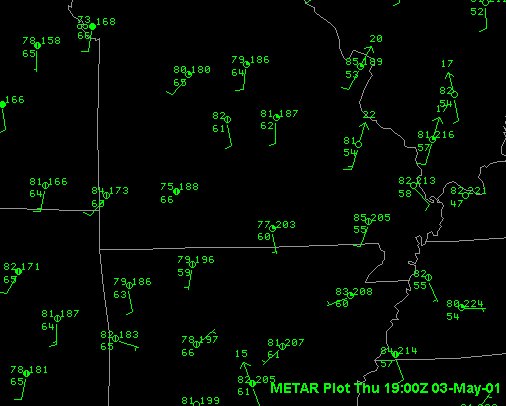
| Here
is the same plot, just zoomed in several times. Now, instead
of only one station in Missouri plotted as the image above shows,
there are many. This is how you increase the density of data
on a surface plot. Simply zoom in and FX-Net shows a higher
density of data, called progressive disclosure. You can also use
the global Density
button on your toolbar to increase the density of data. |
 |
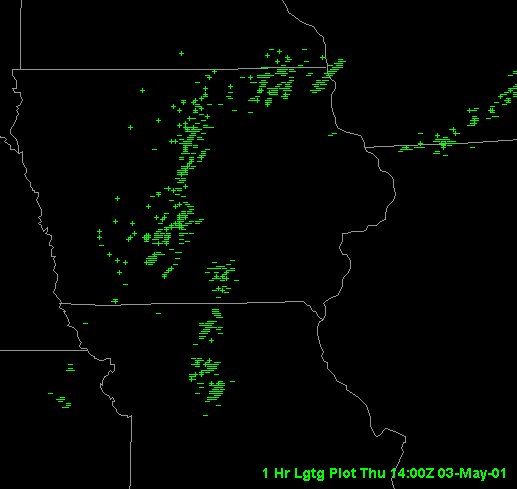 |
This
is a plot of lightning strikes in a one hour time frame. It
was plotted on CONUS scale and zoomed in to get a closer
look at the distribution. In FX-Net, there's 1 hour, 15 minute,
and 5 minute lightning plots, and a 1 minute lightning sequence.
Represented here are cloud to ground strikes (-) and ground to cloud
strikes (+). |
|