![]()
|
When
you choose
The 4 Sat Composite set of imagery is available only when a N. Hemisphere map is selected from the map scale drop-down menu and present in the primary window.
Below
we will take a quick look at the imagery and give a short explanation
of each image. |
Always set your map scale in the primary window to the smallest possible scale before loading the data, to ensure the highest resolution data will load. For example, if you load IR Window on a CONUS map, you get 4km imagery; and if you load it on the Center Regional scale, you get higher resolution data. Do this instead of loading on the CONUS scale and zooming in. Zooming in on satellite data tends to degrade the image after one or two clicks, so get the highest resolution data on the smallest scale to begin with.
Satellite data loads as 'images' in FX-Net. You may only load one type of image in the primary window at a time, so loading a model image and a satellite image, or a radar and satellite image together is not possible.
Load only as many frames as you need. Always check the Frames box before you load data to make sure you are not loading 16 images when you only need 6, as satellite data takes a longer time to load than other non-image type data.
|
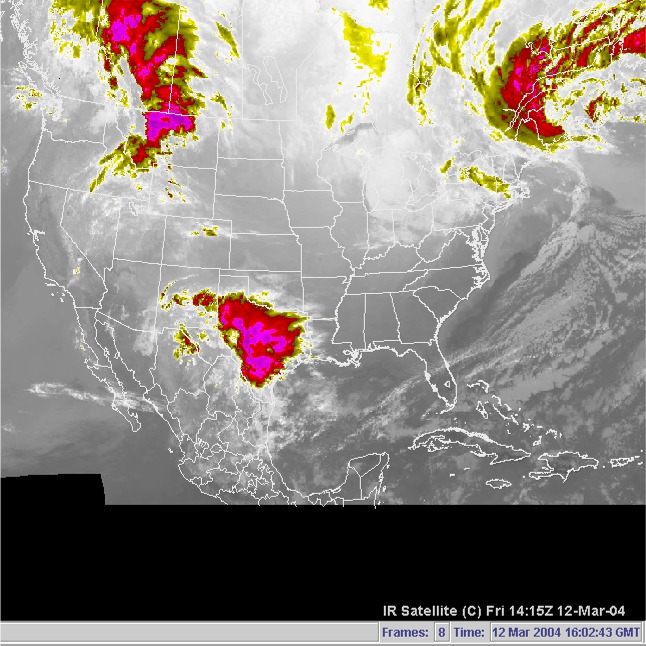
This is what you see when you load IR Window imagery. The emitted IR radiation is enhanced and colorized. Warmer colors are darker, and colder colors get whiter, then into the colored region. This tells us where the highest cloud tops are, among other things.
A short discussion on editing IR Satellite imagery color properties using the FX-Net Color Map Editor is located here. |
 |
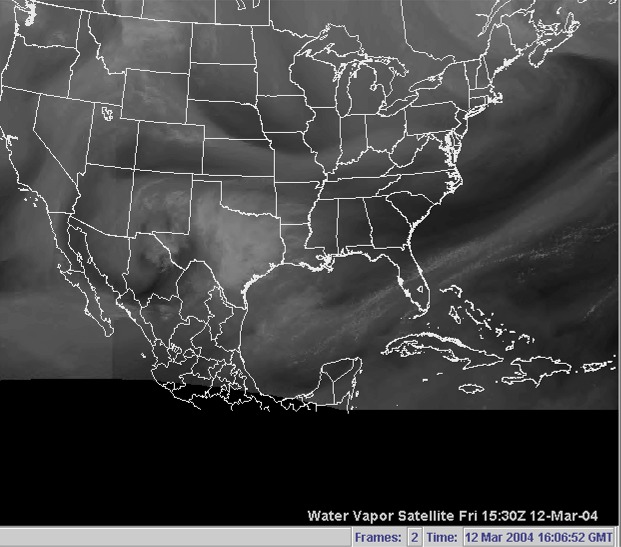 |
This is what loads when you choose Water Vapor from the Satellite menu. It shows the water vapor content of mainly the middle levels of the atmosphere. Also, you can easily see the large-scale movement of weather systems using water vapor loops. |
| This is a visible satellite image. It is just about what you'd see (minus the color of course) if you were looking down on the Earth from 35,000 km. This example is 4km resolution imagery, but higher resolution data is available on smaller map scales. | 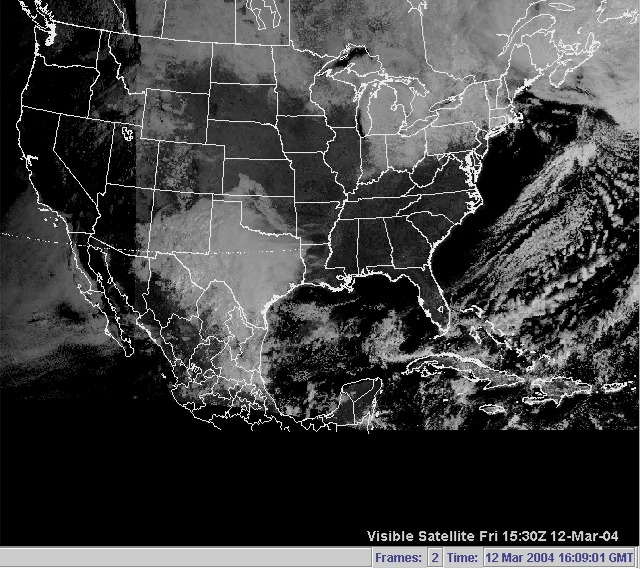 |
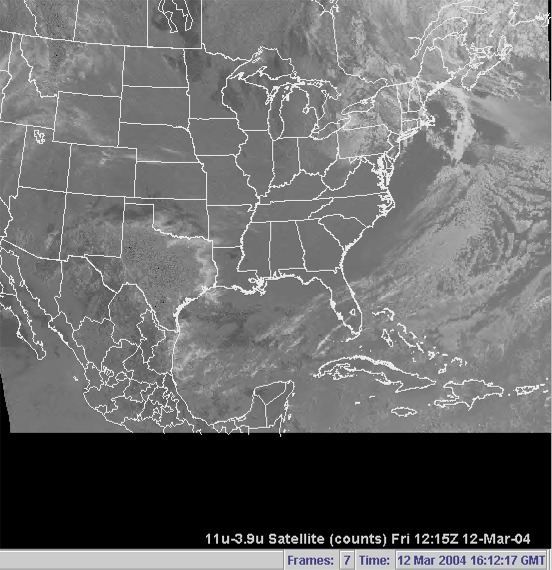 |
This image is what you would see if you chose 11u-3.9u from the Satellite menu. It is a multi-spectral image, it takes the 3.9u from the 11u data and gives a type of image suited to seeing low level stratus or fog. It is often called the fog product, and should be used to analyze fog formation during nighttime. |
| When you select 11u-12u from the Satellite menu, you see this type of imagery. It is also a type of multi-spectral imagery, created by subtracting one wavelength from another. This image is good for analyzing the presence of low-level moisture. | 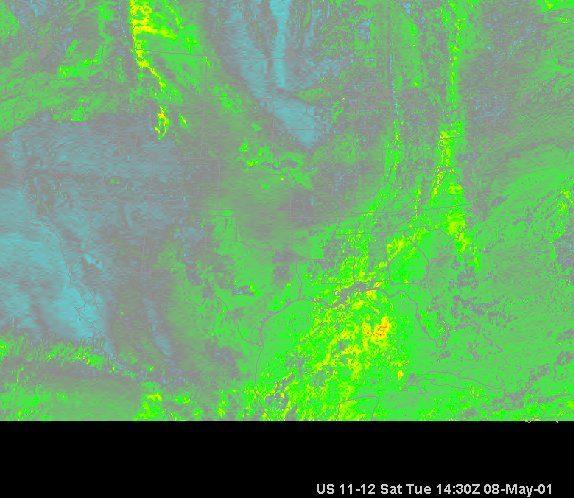 |