
A
very useful feature in FX-Net is the Color Map Editor. Using this,
you may edit any image loaded in the primary window. You can be
very creative with the colors you choose to use, but it takes a bit
of experimenting to get used to using it. Explained below is the
editor itself, and one example of editing a IR Satellite image in FX-Net.
The Color Map Editor
When you
have an image (satellite, radar, numerical model image) loaded in the
primary window on FX-Net, you may edit the image's colors. Choosing  from the main tool bar opens the Color
Map Editor. You will use this editor to change/edit the colors
of the loaded images.
from the main tool bar opens the Color
Map Editor. You will use this editor to change/edit the colors
of the loaded images.
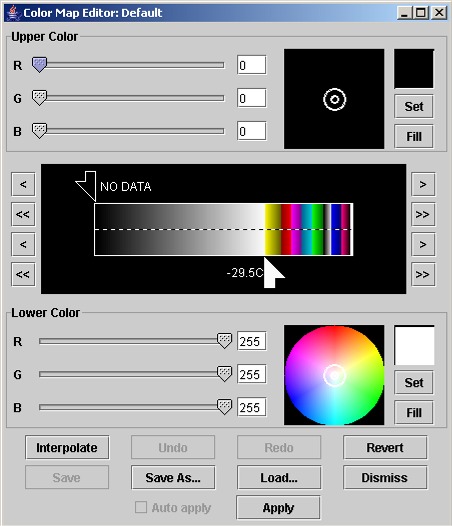
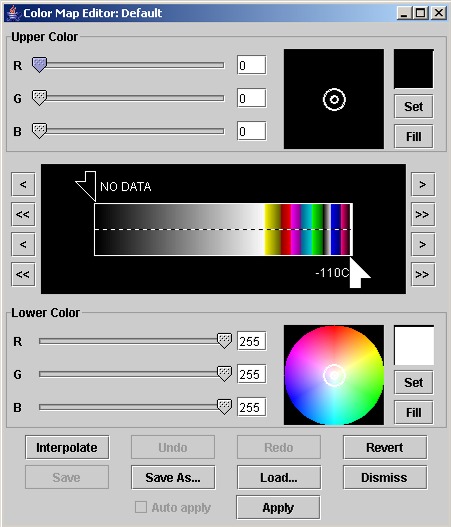
The
Color Bar in the middle is the main place you work. It is here
you set the colors to change in the primary window. There are
two sections named Upper Color and Lower Color where you
will select the colors for the color bar. The Upper Color
pertains to the top arrow, and the Lower Color to the bottom
arrow on the color bar. At the bottom are the buttons to set,
save, change and undo changes, as well as to dismiss the window.
When
opened, the Color Map Editor has the range of colors in the middle
color bar that are present or possible in the image(s) loaded in the
primary window. To change these colors, you slide the arrows that
are on top left and bottom right of the color bar. You do this
by clicking and moving them directly, or using the arrows to the left
and right of the color bar. Then you apply colors to the arrows
and Fill or Interpolate. When you have the colors
edited in the color bar the way you want them, you Apply them
to the images in the primary window.
Next
is a more in-depth discussion of the different sections in the Color
Map Editor window.
|
The
Upper Color and Lower Color sections
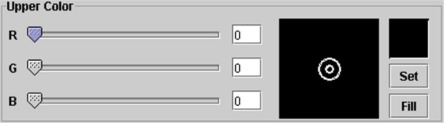
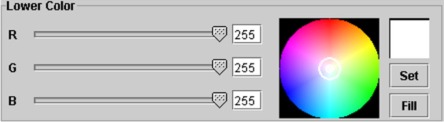
With
the RGB slider bars, you can control the color in the
Color Wheel to the right. The large box on the right side
of the dialog box contains the Color Wheel. When the editor
is in its default mode, the top Color Wheel has the RGB
values set to zero. Consequently the Color Wheel is black.
Increasing the brightness value makes the wheel visible.
The Color Wheel Centroid (a circle with a dot in the middle)
can be dragged around the Color Wheel to change the color in
the Color Swatch, which is above the Set button. Also,
clicking anywhere in the top half of the Color Bar (located
in the middle of the dialog box), fills the top Color Swatch
with the corresponding color; clicking anywhere in the lower
half of the Color Bar fills the bottom Color Swatch. The Set
buttons insert a narrow line of color into the current Color
Bar at the location of the Color Pointer. The color inserted
is the one displayed in the corresponding (i.e., upper or lower)
Color Swatch. The Fill buttons replace the colors
contained within the range specified by the Color Pointers in
the Color Bar with the colors in the upper or lower Color Swatch.
|
|
The
Color Bar
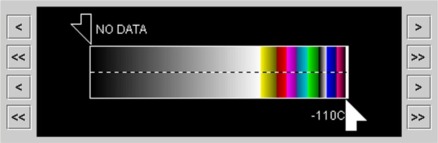
The
Color Bar contains the color table of the current image and is
located in the middle of the dialog box. The arrowhead Color
Pointers along the top and bottom halves of the Color Bar can
be dragged to delineate a range of the color table; that is, the
portion of the Color Bar contained between the top and bottom
arrows. The Color Pointers move independently of one another,
but they cannot move past each other. As the Color
Pointers are dragged along the Color Bar, they display the image
values corresponding to the color pointed to. Thus, for example,
if an infrared satellite image is displayed, moving the
Color Pointer shows the temperature values corresponding
to the colors in the Color Bar. Note:
As the Color Pointers are moved, they are filled with the color
they are pointing to. To
either side of the Color Bar are left- and right-pointing arrows.
These are used to move the Color Pointers along the Color Bar
an increment at a time. The > and < Buttons
move the Color Pointers in smaller increments than the >>
and << Buttons.
|
|
Edit
Controls
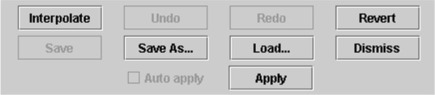
Interpolate:
This button fills the specified range with a (RGB) interpolation
between the colors in the upper and lower Color Swatches.
Undo: This button allows you to
successively undo changes made to the color table. (Not available
at this time)
Redo: This button successively
redoes the last edit that was undone. (Not available at this
time)
Revert: This button returns the
Color Bar (and the displayed image) to its original state.
Save: This button saves changes
that you have made to a color table. If you are editing a read-only
color table, or one that is owned by another user, this menu
button is disabled.
Save As...:
A menu button that opens the Save As Dialog Box in which you
can enter a name for your color table. The color table is saved
in a file containing the customized color tables for the current
user. If the new name of the color table is the same as a name
of an existing color table in this file, a dialog box opens
and asks you if you want to overwrite in existing color table.
Load...: Opens the folder
with saved color tables; for example,if you have a color table
saved for IR imagery, you can open the folder using Load
and select it, the changes are made automatically to the Color
Map Editor, than hit Apply.
Dismiss: Closes the Color
Map Editor
Apply: Applies the changes
made in the Color Map Editor to the images in the primary window.
|
Editing
IR Satellite Imagery
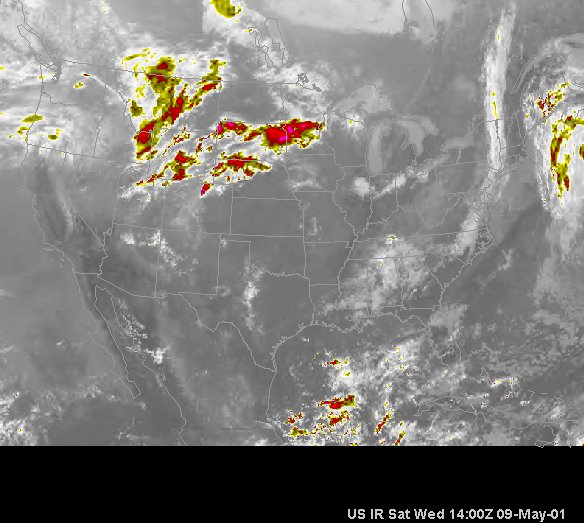
| Shown
above is an image from a loop of IR Satellite that was loaded
in the FX-Net primary window. We want to focus on only the
colder temperatures, so we will edit out the warmer colors by
making them black. Once the loop has loaded, we select
from the tool bar and the Color Map Editor opens.
It looks like the Color Map Editor shown at the
top when if first opens.
As
you can see, we will want to change any shades of grey and white
to all black, so that we may just see temperatures less than
-29.5C. I slide the bottom Color Pointer to the left to
encompass (between the Pointers) the region of colors in the
color bar that need to be edited. The Color Map Editor
on the right shows what has been done. Next, we need to change
the colors in the Color Bar that are between the two arrows.
We will make it all black, so all that will be left are the
colors representing the coldest temperatures.
|
 |
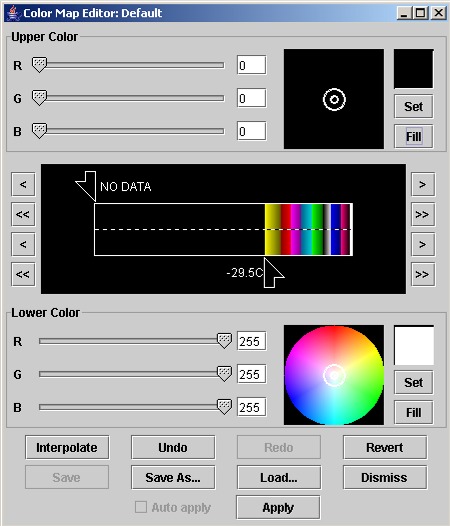 |
Next,
we change the color in the Color Bar between the Pointers to all
black. This can be done two ways.
The
easiest method is to use the color (black) already selected
in the Upper Color editor. I simply click Fill,
and the Editor fills the area between the arrows in the
color bar with the color selected in the Upper Color
Swatch. Fill is the quickest way to change a range of
the color bar to all one color. As you can see to the
left, I clicked Fill in the Upper Color editor
and the color bar was filled black between the arrows.
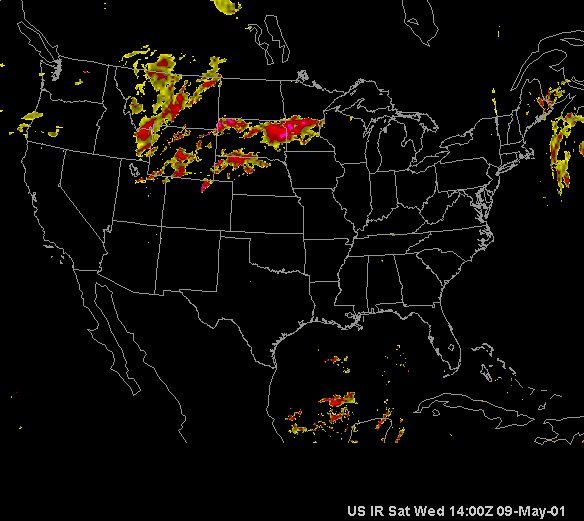
Now I select Apply from the bottom of the Editor, and
the images present in the primary window are changed.
The final image is below.
Another
method would be to use the Lower Color editor to change
the color of the bottom Color Pointer from white to black, then
Interpolate. If you haven't noticed, as you slide
the arrow along the color bar, it changes color. The color
of the Pointer represents what color it is pointing to in the
color bar. First, I would move the bottom Pointer
to the left (shown above) to center the region of colors
between the arrows that I want to edit, and then change the
color in the Lower Color Color Swatch to black by sliding
the RGB slider bars all the way to the left. The
circle would now be black in the Lower Color editor
(like the Upper Color editor). Then I select Set,
which would set the color of the lower Pointer to black and
insert a black line in the Color Bar at the Pointer, and finally
Interpolate, which would fill the region between the
arrows of the color bar black, as it is interpolating from black
(left Pointer) to black (right Pointer).
|
Either way, the final image looks like this one.
Saving
color edits as a Color Table
When you have
edited the images in the primary window, you may save these changes as
a Color Table. For example, if I wanted to use the color edit shown
above many times, I may save it as a Color Table and call it up and apply
it, instead of making the edits to the Color Bar each time. To do
this, when the images have been changed, simply click Save As...
and a dialog box opens with the folder of Color Tables. You name
your Color Table and click Save.
The next
time you load IR imagery and you want to apply the Color Table, simply
open the Color Map Editor and click Load. This opens
the folder containing the Color Tables, and you select the appropriate
one and click Open. This loads the changes in the Color
Bar and you then select Apply and the changes are made to your
images.
Changing
back to the original image is not a problem either in FX-Net. If
you have closed the Color Map Editor, open it again by clicking
on the main tool bar. It will open showing the changes you have
made to the images in the primary window. Simply click Revert
and the Color Map Editor and the images in the primary window will
revert to the original configuration. Then you can redo the changes
if you want to try again.
Using the
Color Map Editor takes practice to find out how it interpolates
colors, and to find out what images it works best for. When you
change the colors, it changes all the images in the loop. Also,
if you make changes to an image, you may save these changes in a Procedure.
|